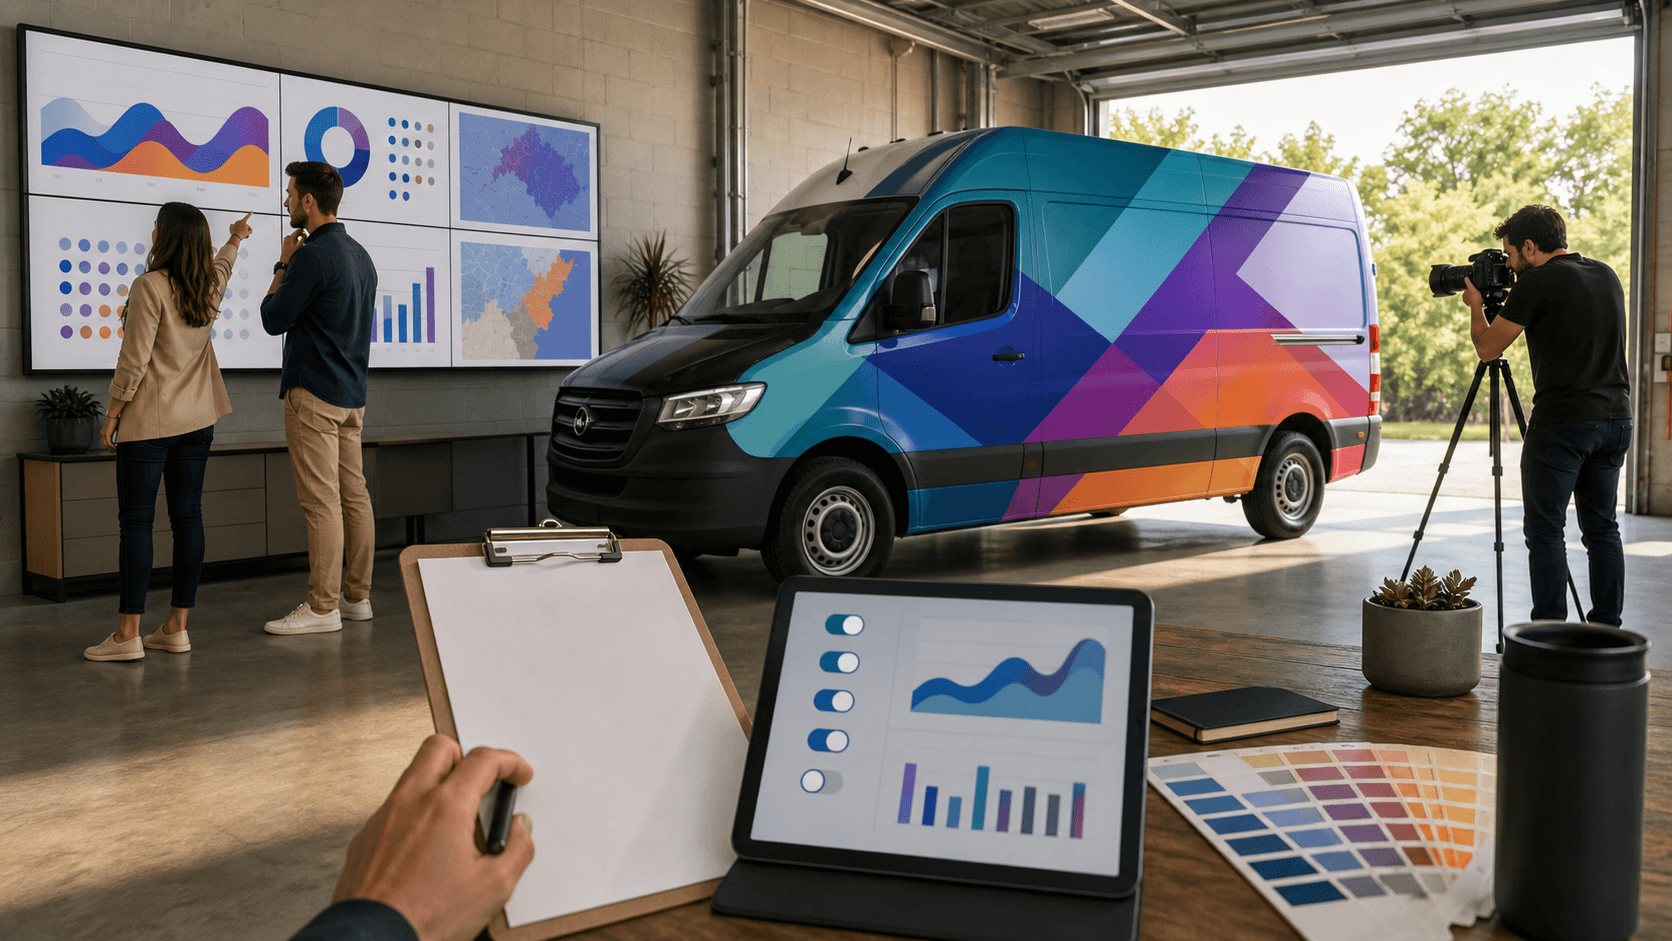
Turning Fleet Graphics Into Measurable Brand Power
Fleet graphics should not be random stickers on trucks. They should be planned, measured, and managed like any other major brand channel. When they are, every mile and every stop can work harder for your business and elevate how your brand is seen.
Together, we can turn a moving fleet into a confident, consistent brand presence on the road. Large, multi-site brands know the pain of treating graphics as one-off purchases. Different regions order on their own. Artwork drifts. Materials change. Over time, the fleet stops looking like one brand. Strategic fleet graphics management pulls all of this into one system backed by clear KPIs, so every vehicle reinforces your story instead of diluting it.
When we bring governance, budgeting, and performance dashboards together, we can keep brand consistency across seasons, regions, and vehicle types. We also cut waste, avoid rushed emergencies, and move faster. In this article, we walk through how to define the right KPIs, build practical guardrails, match budgets to growth, and turn dashboards into tools that teams actually use every week, so your fleet becomes a stronger, more visible extension of your brand.
Building Governance That Protects Brand Integrity
Governance sounds formal, but it is really just a shared rulebook we create together. In fleet graphics management, governance covers the standards, workflows, roles, and approvals that keep the brand strong without slowing everyone down.
Some simple governance KPIs help you see if that rulebook is working:
- Brand compliance rate by fleet or region
- Percentage of assets using current artwork and specs
- Average approval cycle time from request to green light
- Number of unplanned reprints due to errors or outdated files
When these numbers are healthy, fleets look sharp and consistent, and your brand presence feels unified and intentional. When they slip, you start seeing old logos, faded colors, and layouts that do not match, signs that brand resonance is weakening on the road.
Governance becomes much easier when we centralize the pieces that tend to drift. For example, many brands benefit from:
- A central brand library with approved logos, colors, and layouts
- Templated designs for common vehicle types and sign formats
- Standard material specs that fit your climate and usage patterns
For a business with vehicles in all kinds of weather, from hot sun to heavy rain, consistent materials matter just as much as consistent art. Standard specs help avoid peeling, fading, and constant repair runs, so your message stays vibrant and visible.
The real power of governance is how it brings teams together. When marketing, operations, procurement, and installers work from the same playbook, everyone is climbing the same mountain instead of pulling in different directions. Requests are clearer, timelines are smoother, and trucks spend more time on the road showing a strong, united brand. With the right governance in place, every vehicle becomes a reliable, high-impact touchpoint for your customers.
Budgeting with Confidence Across Seasons and Cycles
Budgeting for national fleet graphics is not a simple annual line item. Budgets need to cover new vehicle launches, lease returns, seasonal campaigns, accident repairs, and the occasional rebrand. Without a clear plan, budgets swing from shortage to scramble.
Together, we can build a budget strategy that supports steady progress instead of last-minute stress. To keep control, it helps to track financial KPIs that connect spend to real activity, such as:
- Cost per wrapped vehicle by type
- Lifetime graphic cost per mile
- Spend by region or business unit
- Percentage of budget on maintenance vs net new installs
These numbers show where dollars are going and how they support growth and visibility. They also make it easier to talk about budgets with finance and leadership, because you can clearly link fleet graphics investments to brand reach and performance.
Seasonal cycles add another layer. Around mid-year, many brands are:
- Planning Q3 and Q4 campaigns
- Adjusting fleets for back-to-school or pre-holiday shipping
- Shifting routes and schedules to match demand
If your graphics budget is tied only to calendar years, it can miss these real-world peaks. A better way is to tie budget blocks to known cycles: planned vehicle swaps, seasonal pushes, and refresh windows. That way, your fleet is ready to shine when attention is highest.
Smart planning can stretch each dollar without cutting quality. Some helpful tactics include:
- Volume planning, so larger batches of graphics are produced together
- Standardized materials that are tested across your main climates
- An optimized installer network that reduces travel time and repeat visits
When fleets across regions follow shared specs, you earn economies of scale while still keeping a durable, premium look on the road. Together, we make every investment work harder, supporting a strong, recognizable brand that customers notice and trust.
Designing Performance Dashboards That Teams Actually Use
Dashboards turn scattered data into daily guidance. A practical fleet graphics management dashboard does not need to be fancy, but it does need to be clear, trusted, and energizing for the teams who use it.
At a base level, most teams benefit from a dashboard that brings together:
- Asset counts by status (planned, in production, installed, due for refresh)
- Install timelines and on-time completion rates
- SLA adherence for installs, removals, and repairs
- Brand compliance scores by region or provider
- Repair tickets and repeat issues
- Graphics costs by month, region, and vehicle type
Different users will care about different slices. Executives often want a high-level summary that answers questions like, Are we on track? Are we consistent? Are we growing our presence in key markets? Operations teams care about install ETAs, downtime, and which assets are off the road. Brand and marketing teams want visibility into artwork in use, campaign timing, and any off-spec graphics that could weaken impact.
Well-designed dashboards also lean on simple, visual views, such as:
- Maps showing branded vehicle density by market
- Trend lines for install time, uptime, and approval cycles
- Side-by-side comparisons of campaigns, layouts, or material types
Real-time or near-real-time data keeps these dashboards from becoming dusty reports. Clear ownership makes sure someone is watching and acting on the numbers. When teams can glance at a scorecard in the morning and see where to focus, the dashboard becomes a living tool instead of a monthly chore, helping all of us make smarter, faster decisions that strengthen brand visibility.
Turning Field Data Into Insights That Elevate Visibility
Fleet graphics work in the real world, not just in a brand book. Field data is where we see how designs hold up, how routes support visibility, and how the brand feels out on the streets and at job sites.
Some field-focused KPIs that tie directly to visibility and resonance include:
- Vehicle uptime with full, undamaged graphics
- Route density in key markets or target zones
- Impression estimates based on traffic patterns
- Parking locations and dwell times in high-visibility areas
From there, quality and durability metrics help protect your brand:
- Failure rates by material, climate, or vehicle type
- Average lifespan of graphics before refresh
- Share of graphics replaced proactively vs due to failure
Feedback loops are just as important as numbers. Drivers, branch managers, and installers see what actually works. They know when copy is too small to read in traffic or when a key message is hidden by door handles or ladders. Building a simple way for them to share notes back to the central team helps sharpen every new wave of installs.
When we combine GPS and route data, exposure estimates, and campaign timing, we can make smarter choices on layout and color contrast. For example, high-speed highway routes may call for bolder, simpler visuals, while slower city routes might support more detailed calls to action. Over time, together we turn the fleet into a tuned system, one where every graphic is intentionally designed to catch the eye, carry your message clearly, and deepen brand recognition.
Scaling Fleet Graphics Management with a Trusted Partner
When governance, budgeting, and dashboards come together, fleet graphics stop being ad hoc expenses and start acting like a strategic growth engine. Every wrap, decal, and sign is planned, measured, and maintained with purpose. Teams feel more confident, and the brand looks stronger in every market.
At AGS SEO through American Graphics & Signs, we are proud and grateful to support multi-site brands with nationwide fleet graphics, vehicle wraps, and commercial signage. Our focus on expert design, durable materials, and a trusted installer network is built to match the kind of structured, KPI-driven programs we just walked through.
We see our customers as partners in progress. Together, we can turn fleets and facilities into consistent, high-impact brand assets that redefine how your brand shows up, with stronger visibility, richer storytelling, and a bolder presence in every community you serve. By aligning creativity with practicality, we climb the mountain of complex fleet management side by side and unlock measurable brand power with every mile.
Get Started With Your Project Today
If you are ready to streamline how you handle vehicle branding across your entire fleet, our team is here to help. Explore our fleet graphics management solutions to keep every vehicle on-brand, compliant, and looking its best. At AGS SEO, we work with you to plan, design, and coordinate installations that fit your schedule and budget. Have questions or need a custom quote right away? Just contact us to get started.