Turn Every Mile Into Measurable Brand Lift
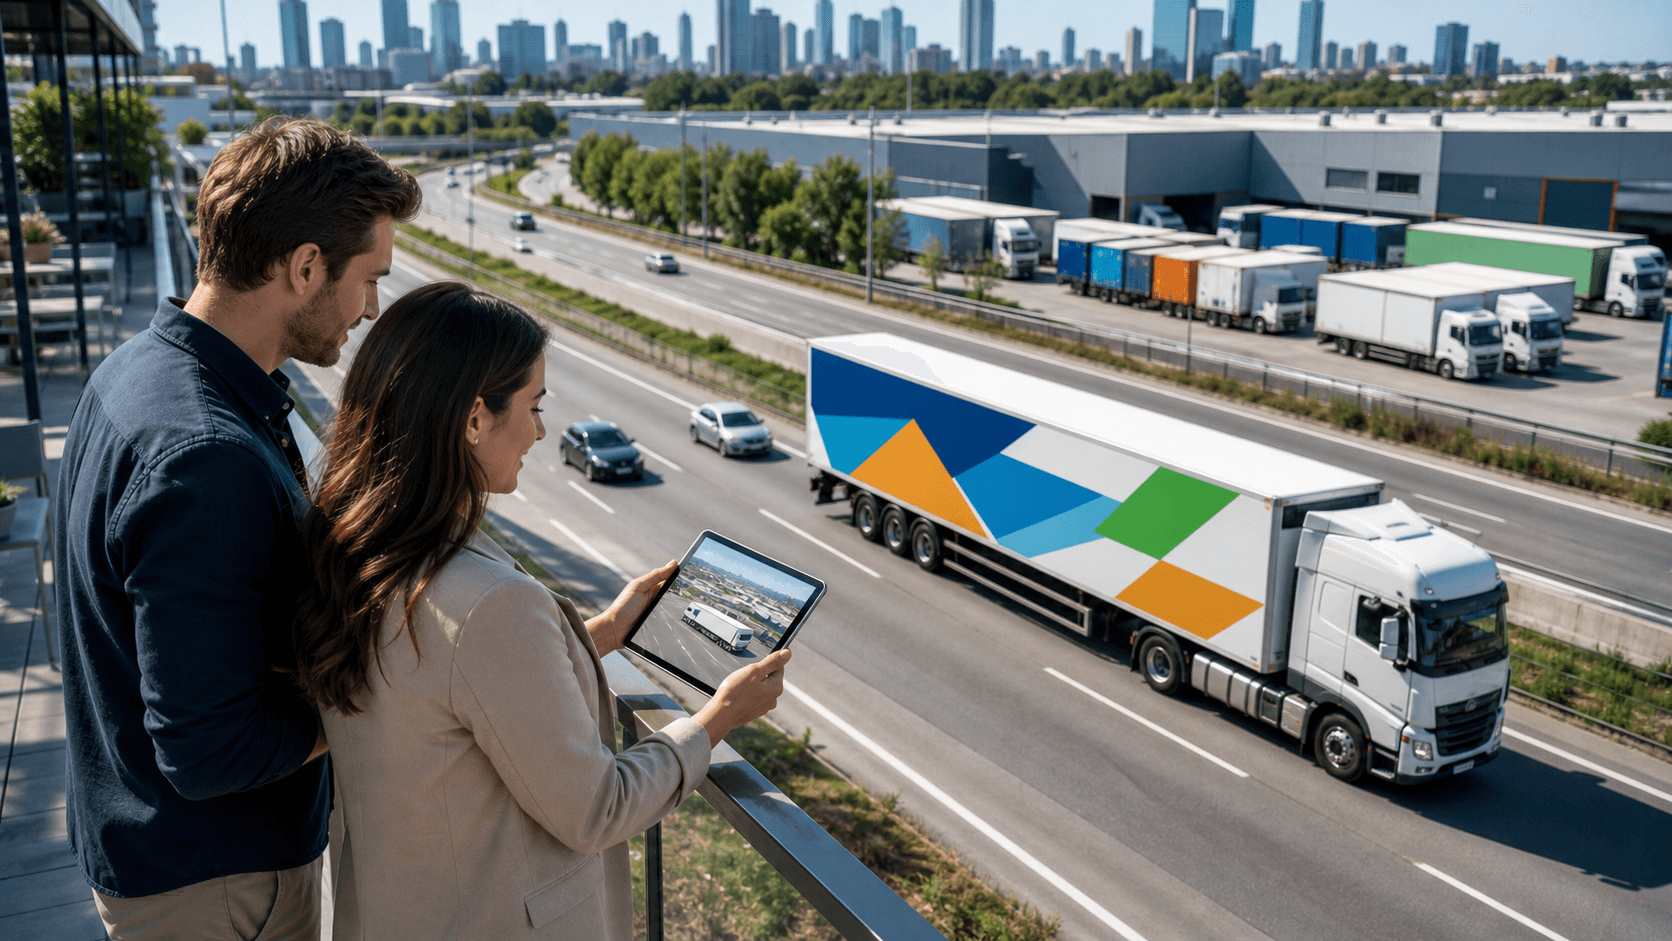
Fleet graphics are not just rolling billboards. With the right setup, they can be measured, tested, and improved just like your digital ads. If your brand runs vehicles every day, you already own a powerful media channel. The real question is whether you can prove what that channel does for awareness, perception, and visits.
Many teams spend time and budget on fleet graphics management, then stop at counting wraps, miles, and markets. That is helpful, but it does not tell you if people actually remember your brand or feel more ready to visit. Late summer is a smart time to build a measurement plan so you can guide Q4 campaigns and next year's fleet strategy with real numbers, not guesses. At American Graphics & Signs, we care about design that looks great on the road and also stands up to serious measurement.
Why Fleet Graphics Deserve a Brand Lift Framework
Your vehicles show up in the same places day after day: near stores, on key highways, in busy neighborhoods. That steady presence works a lot like high-frequency media. People see your brand during commutes, errands, and lunch breaks, in the same real-world spaces where decisions happen.
Yet many programs stop at basic reporting:
- How many vehicles are wrapped
- How many miles they drive
- How many markets they touch
Those numbers are fine for operations, but they do not answer questions like:
- Did awareness go up in our delivery zones?
- Did our message shift how people see us?
- Did intent to visit rise along high-traffic corridors?
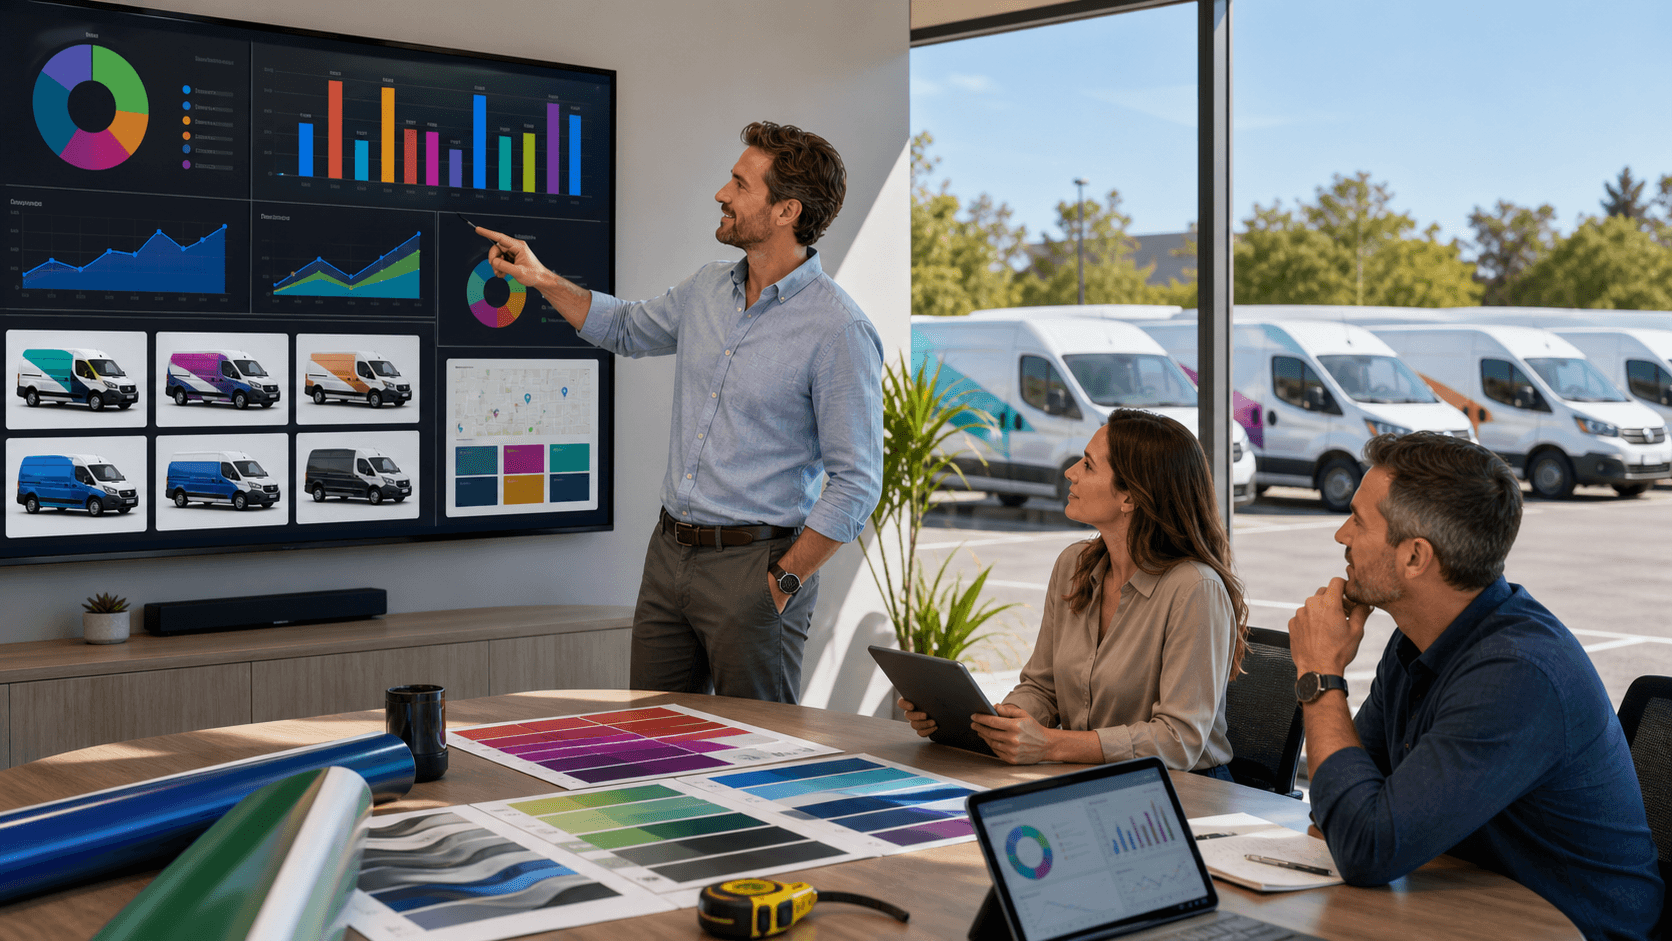
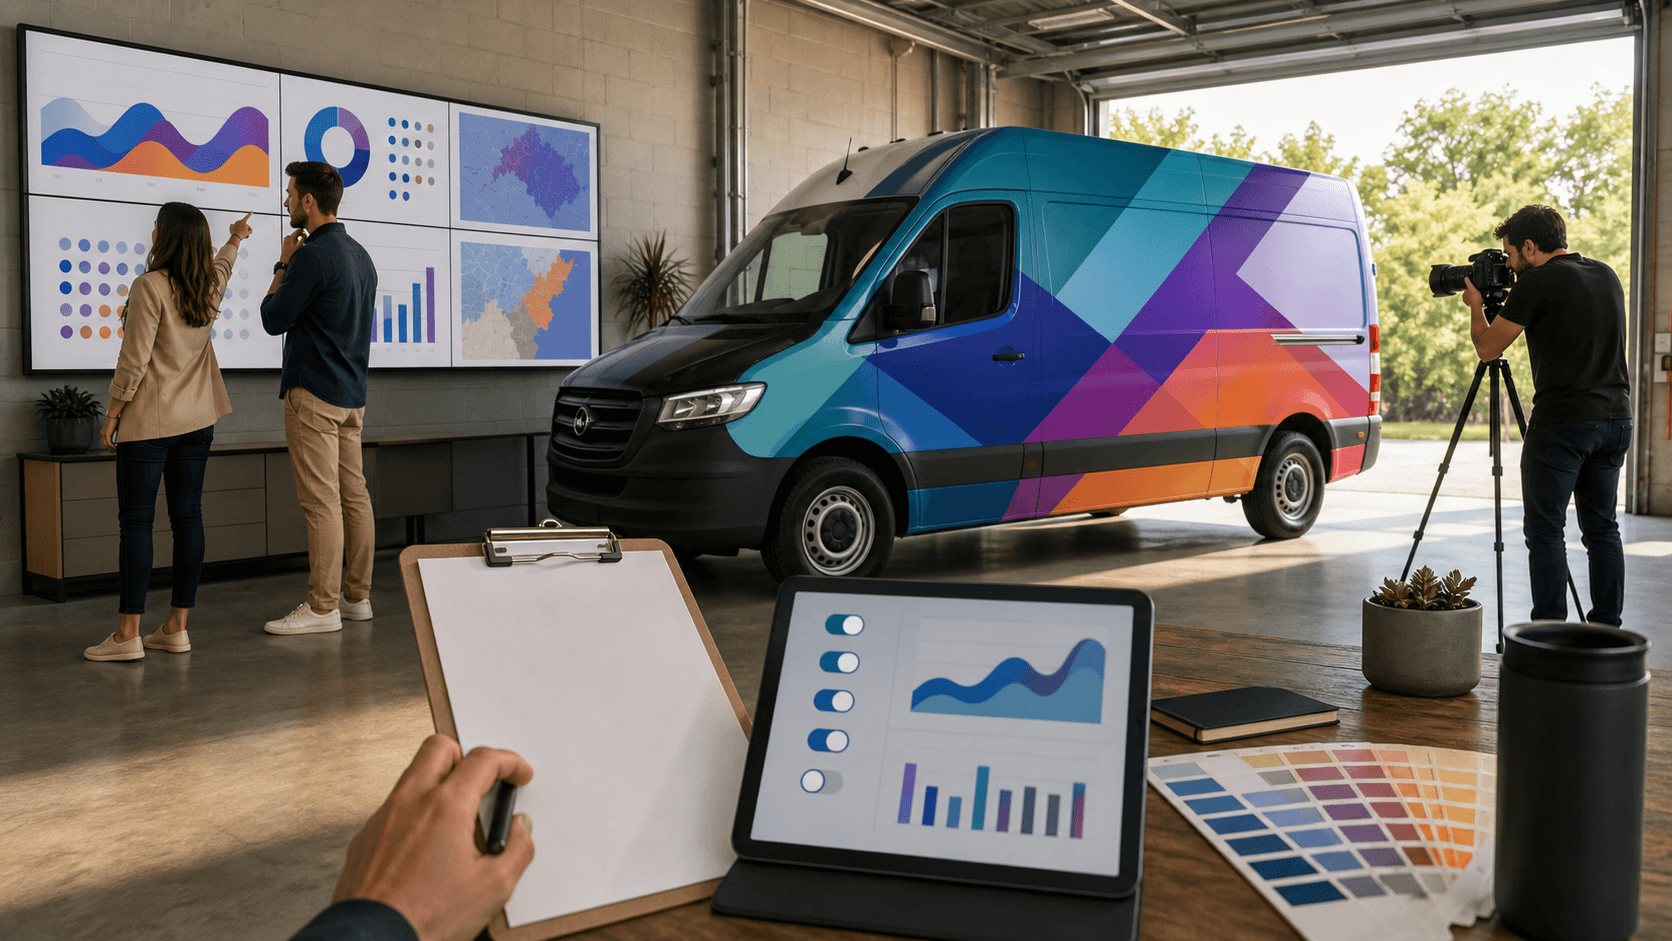
Marketing teams are under pressure to treat every channel as accountable. That includes out-of-home formats and rolling media. The good news is that you can pair spatial data like routes, traffic, and demographics with control versus exposed areas and survey-based brand lift. When those pieces come together, you can finally see which miles actually move the brand.
Designing Control vs. Exposed Routes That Actually Work
In an out-of-home context, "exposed" means people who have a real chance to see your wrapped vehicles often. "Control" means similar people who rarely or never see them. The goal is to compare these groups so any brand lift can be tied back to the fleet graphics, not random noise.
Good control and exposed routes should match on:
- Demographics, like age ranges and income levels
- Traffic density and commute patterns
- Urban versus suburban mix
- Level of media noise and competing signage
That way, the main difference is the amount of vehicle branding in view. Late summer planning also needs a calendar check. You want to avoid big events that could distract or spike awareness on their own, like major holidays or large festivals. For seasonal brands, match your test window to peak patterns, such as back-to-school traffic or summer tourism waves.
Operational discipline matters here. That means:
- Assigning specific vehicles to specific test routes
- Coaching drivers to stick to those paths
- Logging miles and time-of-day with GPS
- Working with dispatch so control areas stay clean
When route design is thoughtful and stable, your test results are easier to trust. That gives leaders confidence to adjust fleet size, plan wrap refreshes, or enter new markets using clear evidence instead of guesswork.
From Routes to Impressions Modeling and Exposure Scoring
Once control and exposed areas are set, we move from "where trucks drive" to "how many people likely saw them." This is where route data connects with modeled impressions. GPS logs tell you where a vehicle went, how long it stayed in heavy traffic, and what time of day it passed through each area.
You can layer this with outside data sources such as:
- Traffic counts for key roads
- Census-based audience profiles
- Mobile movement data that shows how people flow through zones
From there, you can build an exposure index for each market. That index might blend:
- Impressions per mile
- Weekly frequency of exposure
- Audience quality, such as alignment with your core customers
The exact recipe is less important than being consistent. Write down your exposure model and keep it stable across tests. When you do that, you can compare results over time, across cities, and across different fleet sizes. Those modeled exposures then become the backbone of your brand-lift work. You can look at how higher exposure levels line up with stronger awareness, better perception scores, or higher intent to visit your locations.
Pairing Survey-Based Brand Lift with Modeled Exposure
Modeled impressions tell us who likely saw the vehicles. Surveys tell us how they felt and what they remember. To get that picture, you run brand lift surveys in both control and exposed areas.
A strong survey program usually includes:
- Unaided awareness questions like "Which brands come to mind for this category?"
- Aided awareness with your name or logo shown
- Message recall prompts tied to your fleet graphics
- Perception items that match your brand strategy
- Likelihood to visit or buy
Sampling is key. You want respondents who live, work, or travel along the test routes or inside clear market boundaries. Both control and exposed groups should look similar in age, gender, and other key segments. You can then group answers by modeled exposure level, such as low, medium, and high. From there, compare lift in awareness or intent across those groups and against the control. Basic statistical checks can show if differences are likely real, not just random noise.
Timing matters too. Run a baseline before new wraps hit the road. Then, after vehicles have been active long enough for repeated exposure, field a post-wave while recall is still fresh. This pattern gives you a clean before-and-after view of brand lift driven by your fleet graphics.
Turning Brand Lift Insights Into Creative and Route Optimization
Once results are in, the fun part begins. You can see which routes deliver the most awareness lift per impression, which audience segments react strongly, and what people actually remember from the wraps. If recall is low in certain areas, it may point to cluttered environments or complex designs.
Those learnings feed straight back into design and routing, for example:
- Simplify layouts where people cannot repeat your message
- Enlarge logos, URLs, or directional cues that matter most
- Use higher contrast colors on busy city streets
- Test bolder graphics on wide-open highways
Routing choices also become more focused. You might move wrapped vehicles into corridors that showed high lift, pull back from low-value routes, or run A/B tests with different creative on similar paths. This works best when marketing and operations teams act as one unit. Marketing sets the test logic and KPIs, while operations keeps routes and schedules steady so the data stays clean.
Over time, these insights can inform more than just vehicles. What you learn about colors, messages, and viewing distance can influence storefront signs, window graphics, and interior branding. That way, your fleet graphics management and your fixed signage work together as one clear, high-impact visual system.
Building Your Next Growth Curve on Smarter Rolling Media
When fleet graphics shift from "wrap it and hope" to a measured, test-ready program, every mile becomes part of a smart growth curve. You are no longer guessing which markets or designs work. You can point to clear brand-lift results linked to specific routes, exposure levels, and creative choices.
A simple pilot in a few key markets is often enough to prove the value of this approach. Define control and exposed routes, set up an exposure model, and run a focused brand lift survey. From there, you can scale what works. At American Graphics & Signs, we bring together high-impact fleet design, nationwide installation, and a measurement mindset so brands can treat vehicles as true media assets. When rolling signs are planned this way, they do more than look good; they help build measurable brand strength on every route your team runs.
Get Started With Your Project Today
Our team at AGS SEO is ready to help you streamline your fleet graphics management so your vehicles stay consistent, on-brand, and easy to maintain. We work closely with you to understand your goals and build a graphics plan that fits your operations and budget. If you are ready to move forward or have questions, simply contact us and we will respond promptly with next steps.